Enhanced timeline visualization
Publications Management offers two Timeline components to visualize milestone dates. The ppTimelineWrapper component is used for the default timeline visualization that is available on the Publication Planning Document Record Page and the Plan Record Page out of the box while the khvTimelineWrapper component is used for the enhanced timeline visualization that can be added to any record page.
The latter is more configurable and interactive and can therefore be used in place of the former.
Default ppTimelineWrapper component | Enhanced khvTimelineWrapper component |
|---|---|
|
|
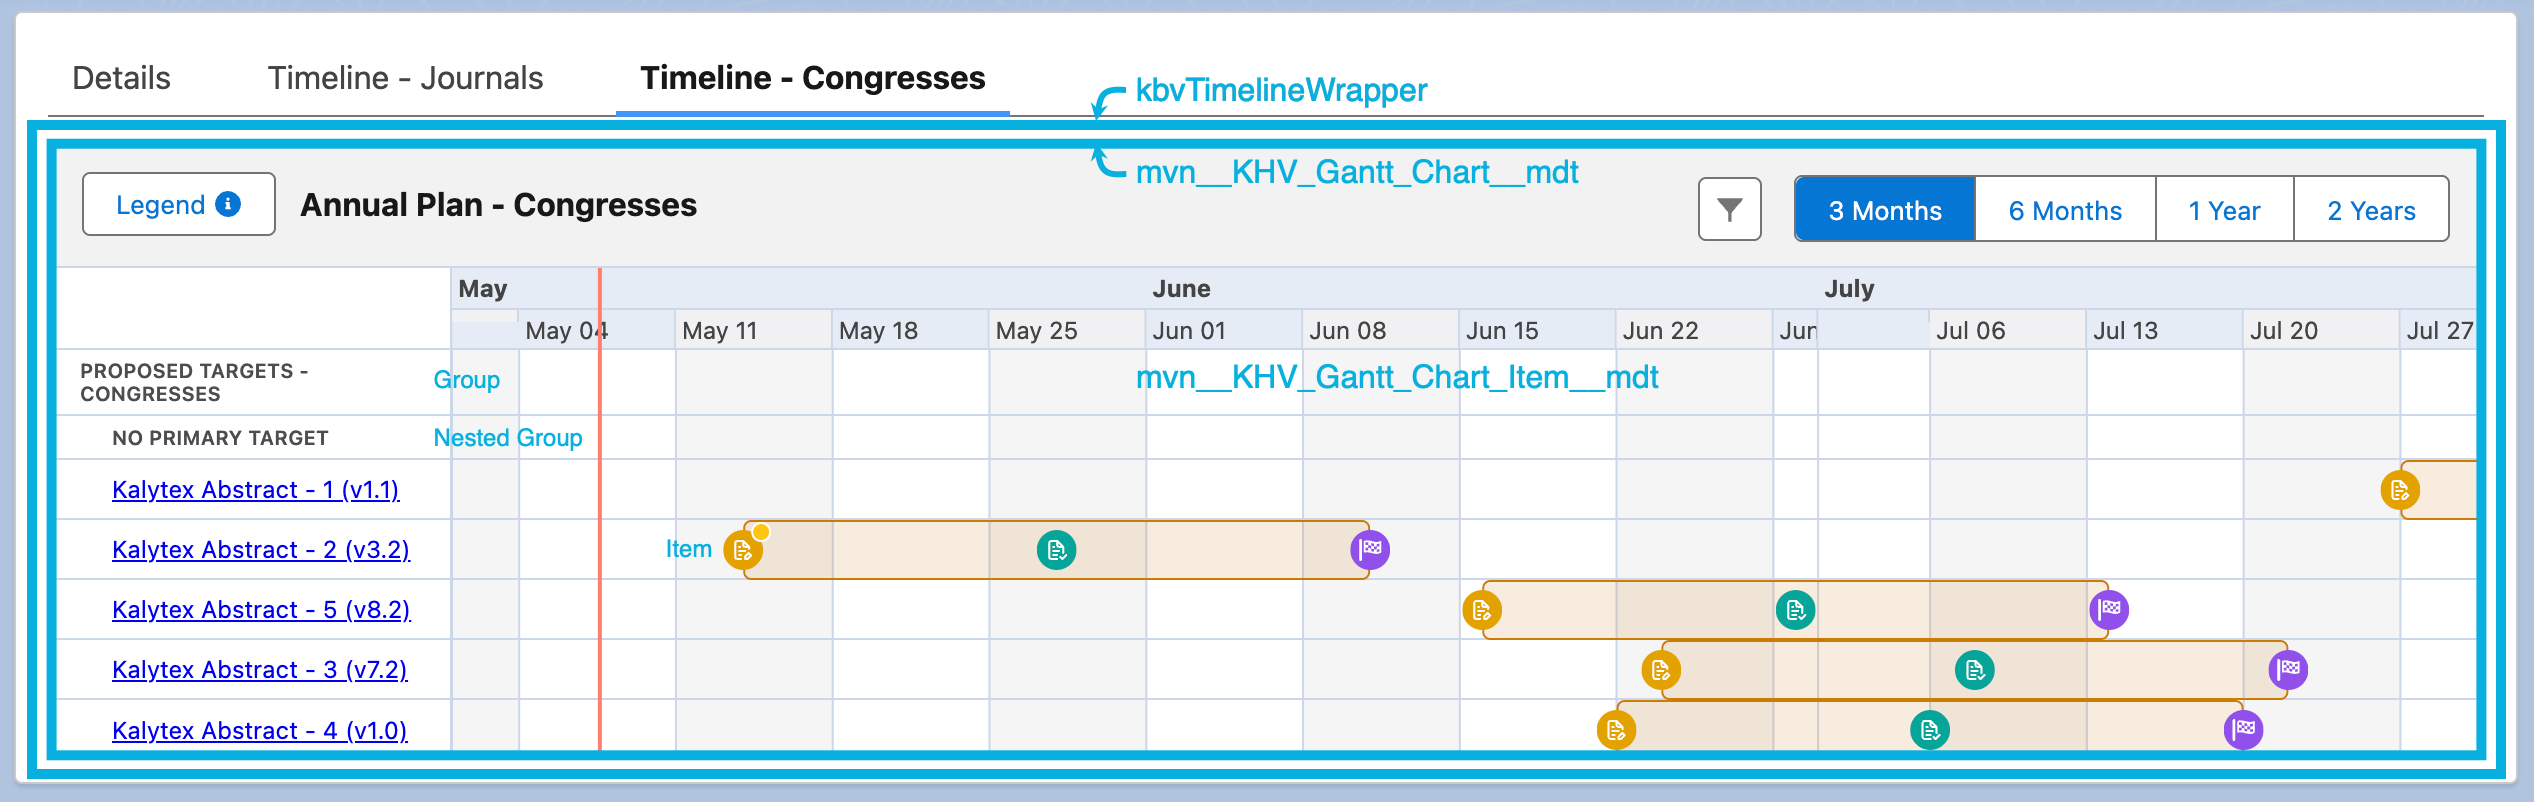
The enhanced timeline visualization that uses the khvTimelineWrapper Aura component builds on vis.js to display a customizable timeline view in the form of a Gantt chart visualization and can be configured with the following custom metadata types:
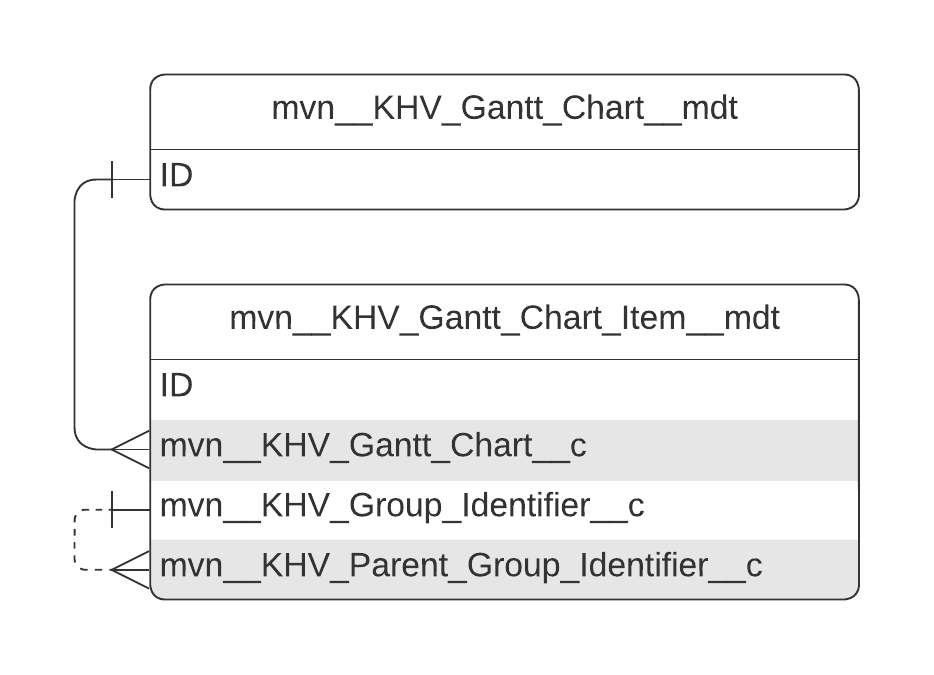
The Gantt Chart (
mvn__KHV_Gantt_Chart__mdt) custom metadata type, which acts as the container and configures the UI/UX of the timelineThe Gantt Chart Item (
mvn__KHV_Gantt_Chart_Item__mdt) custom metadata type, which configures the data and other individual pieces of information that appear in the timeline
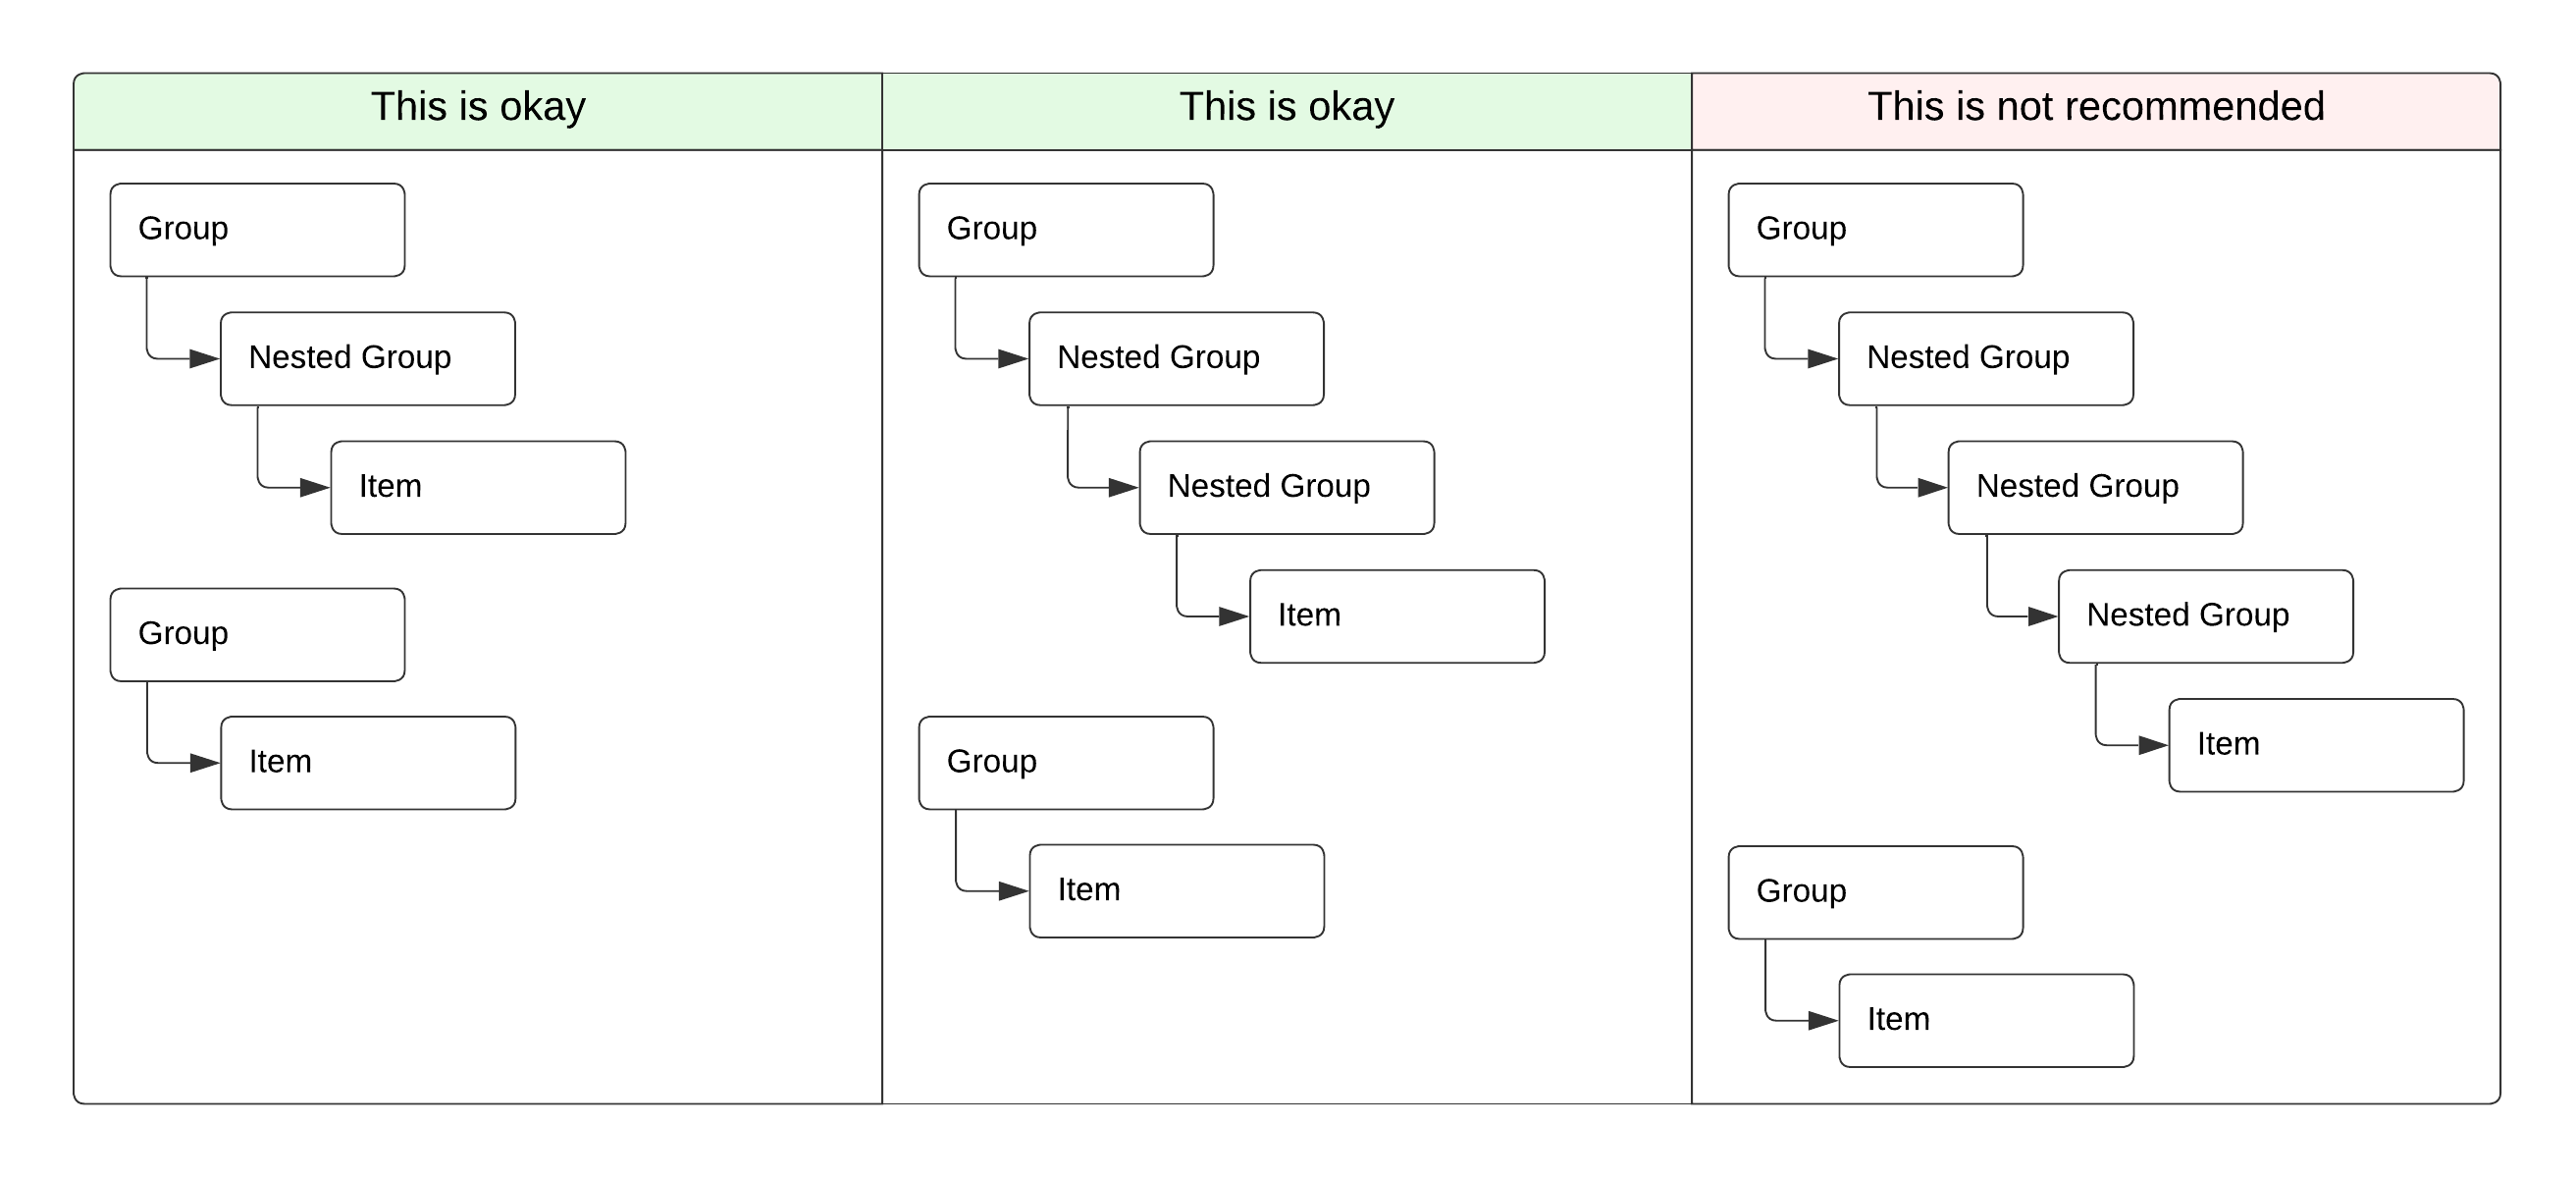
Each Gantt Chart Item metadata record directly relates to a parent Gantt Chart metadata record and can indirectly relate to another Gantt Chart Item metadata record. The Item Type (mvn__KHV_Item_Type__c) field, the Group Identifier (mvn__KHV_Group_Identifier__c) field, and the Parent Group Identifier (mvn__KHV_Parent_Group_Identifier__c) field on every Gantt Chart Item metadata record are all used to establish the relationships between different Gantt chart items; the value on each of the fields determines whether a Gantt chart item is a group, a nested group, a subnested group, or an item. An item is always the child of a group or a nested group while a nested group can be the child of either a group or another nested group. In the case of the latter, the child nested group is then referred to as a subnested group. Komodo Health recommends having no more than a parent-child relationship between nested groups.
 |  |  |
Setup and configuration
To set up and configure the enhanced timeline visualization:
Create one or more Gantt Chart Item metadata records for each Gantt Chart metadata record.
Add the Timeline (
kbvTimelineWrapper) component to the desired record page.(Optional) Configure the label and link on the Gantt Chart Item popovers.
(Optional) Configure the appearance of the Timeline Aura component.
Note
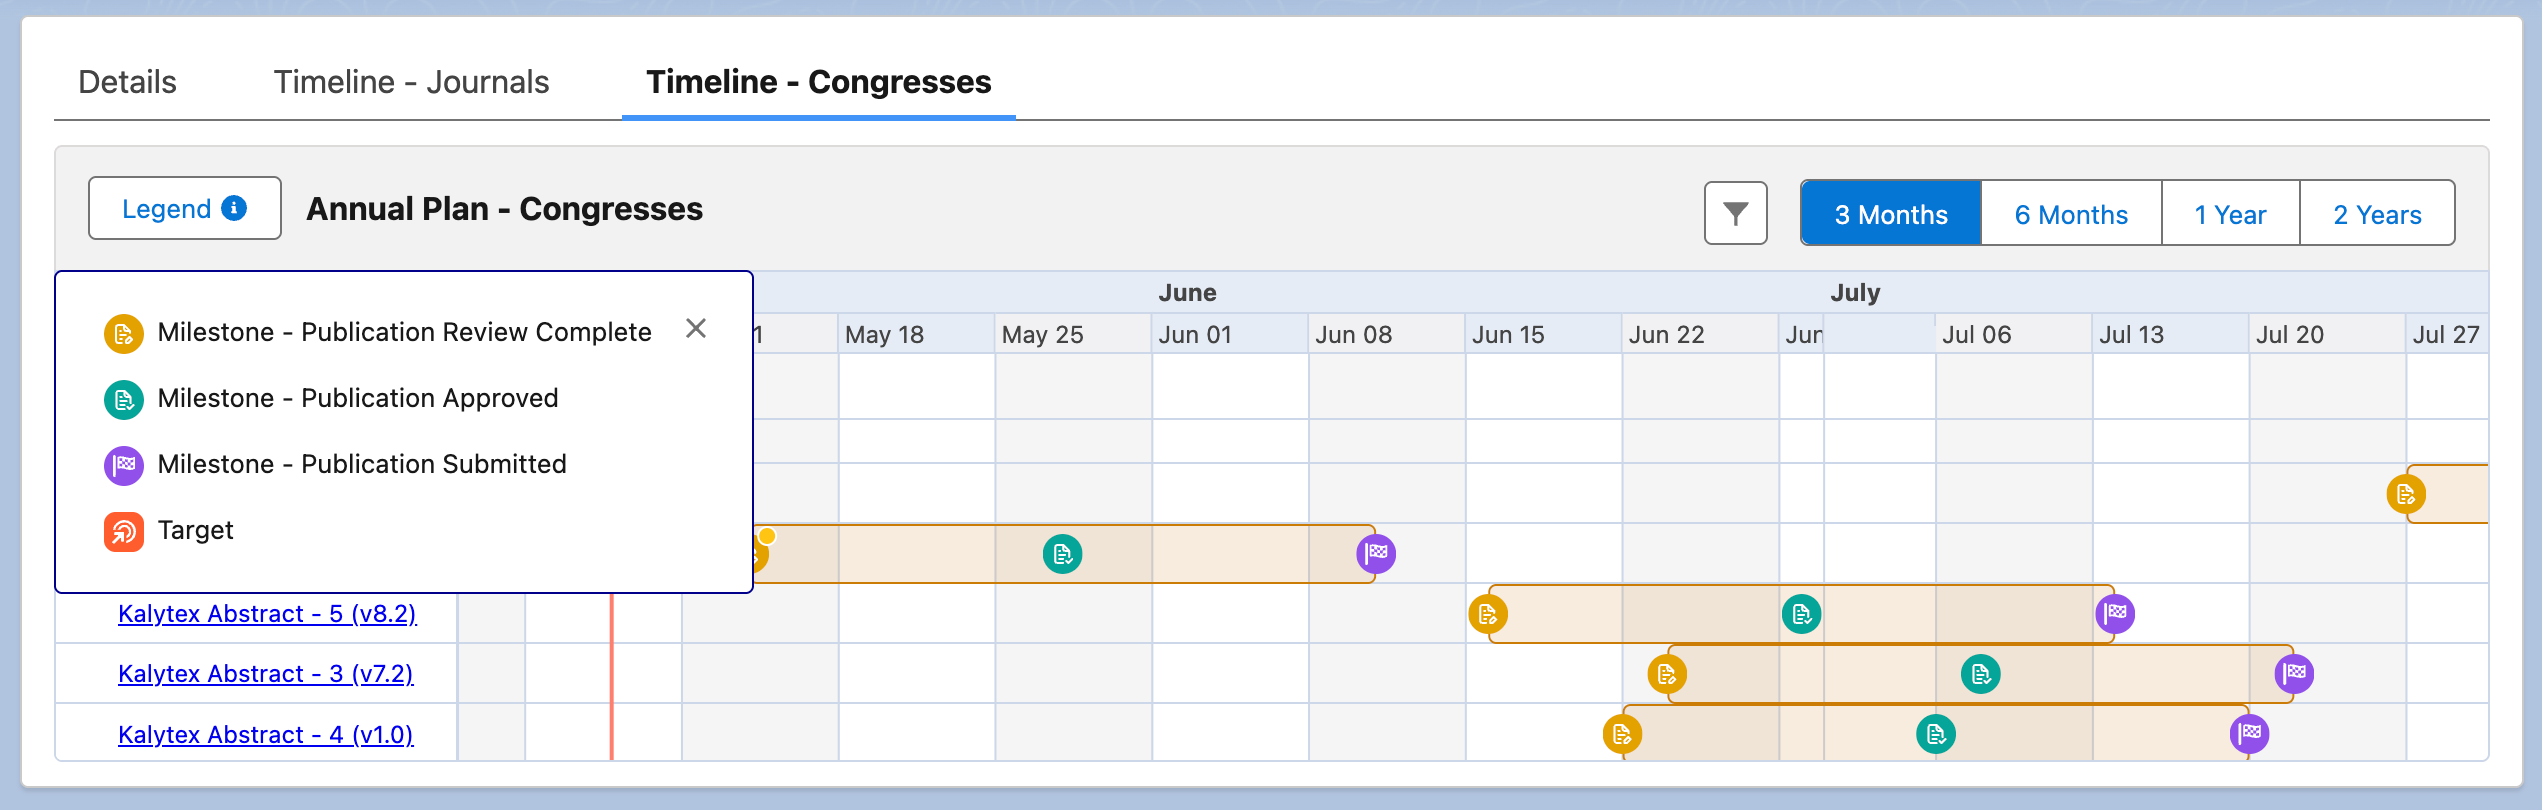
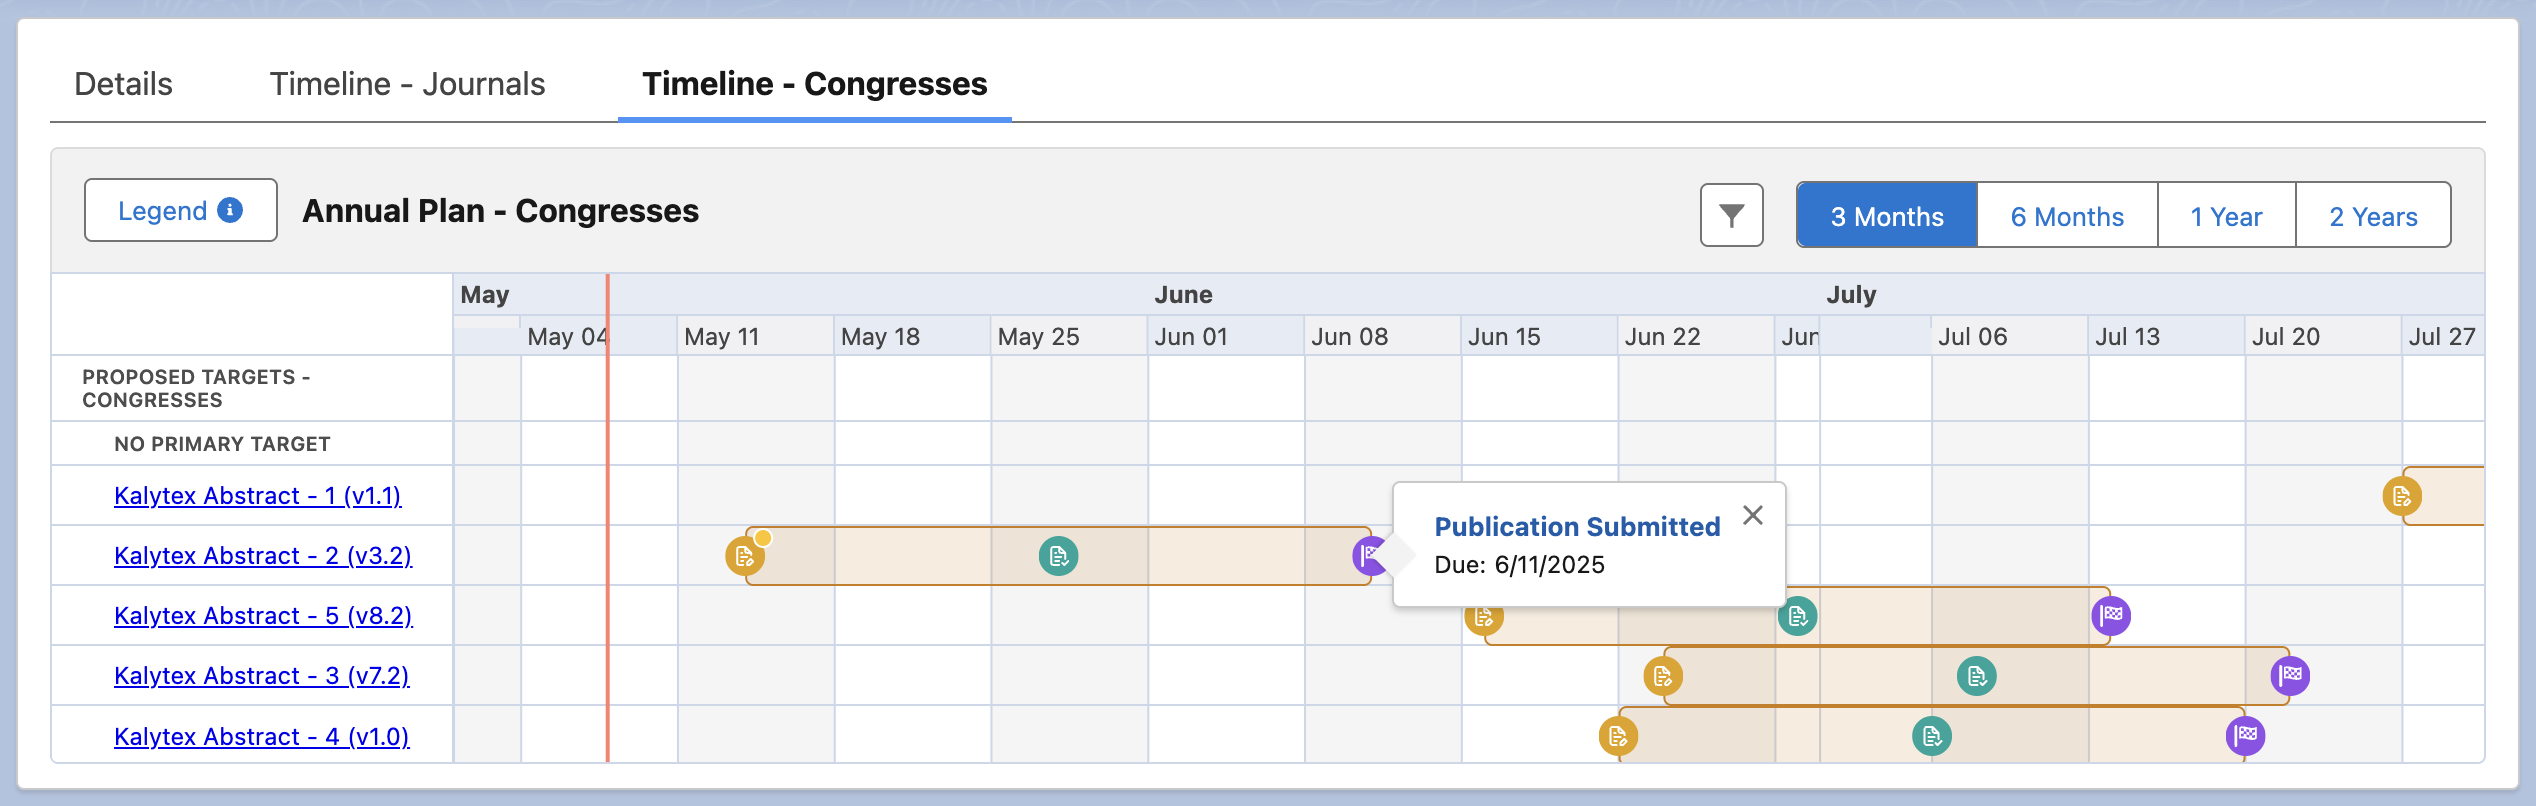
An example configuration of the enhanced timeline visualization can be deployed into your instance of the Publications Management through the Komodo Install Service. The example configuration displays the milestone dates of congresses and journals on annual plans and differentiates among deadlines that are overdue, due today, due soon (i.e., within the week), and completed.
1. Plan out the data structure
To set up the visualization, first determine what information should appear in the timeline. This includes identifying the specific objects, records, and fields to be used and the way in which their data should be organized.
|
2. Create a Gantt Chart metadata record
After the high-level data structure for the timeline has been decided, create a Gantt Chart (mvn__KHV_Gantt_Chart__mdt) metadata record for the visualization. This will act as the container for the individual data points in the timeline.
Field label | Sample value |
|---|---|
Label |
|
Gantt Chart Name |
|
3. Create Gantt Chart Item metadata records
After the timeline container has been created, create a Gantt Chart Item (mvn__KHV_Gantt_Chart_Item__mdt) metadata record for each piece of information to be retrieved and/or displayed in the visualization. This includes the individual data points (i.e., items) to appear in the timeline as well as the text used to describe the data points (i.e., groups, nested groups, and/or subnested groups) in the timeline.
3a. Create Gantt chart items of item type Group
Field label | Sample value |
|---|---|
Label |
|
Gantt Chart Item Name |
|
Gantt Chart | Enter the name of the parent Gantt Chart metadata record, like |
Item Type |
|
Group Sort Order | Enter an integer for the order in which the Gantt chart item should be processed, like |
Group Identifier | Enter a string or a merge field to uniquely identify the group, like |
Content Value | Enter a string or a merge field to display some static or dynamic text for the group, like |
3b. Create Gantt chart items of item type Nested Group
Field label | Sample value |
|---|---|
Label |
|
Gantt Chart Item Name |
|
Gantt Chart | Enter the name of the parent Gantt Chart metadata record, like |
Item Type |
|
Parent Group Identifier | Enter the group identifier of the Gantt Chart Item metadata record that will become the parent, like |
Group Sort Order | Enter an integer for the order in which the Gantt chart item should be processed, like |
Query | Write a query to retrieve data from some object or record, like: SELECT ID FROM <Object_API_Name> WHERE RecordType.Name = '<RecordType_API_Name>' |
Group Identifier | Enter a string or a merge field to uniquely identify each result returned by the query, like |
Group Collection Variable | Create a variable to store the list of group identifiers, like |
Content Value | Enter a string or a merge field to display some static or dynamic text for the nested group, like |
3c. Create Gantt chart items of item type Item
Field label | Sample value |
|---|---|
Label |
|
Gantt Chart Item Name |
|
Gantt Chart | Enter the name of the parent Gantt Chart metadata record, like |
Item Type |
|
Parent Group Identifier | Enter the group identifier of the Gantt Chart Item metadata record that will become the parent, like |
Group Sort Order | Enter an integer for the order in which the Gantt chart item should be processed, like |
Query | Write a query to retrieve data from some object or record. You can use the group collection variable from another Gantt Chart Item metadata record if the other Gantt chart item has a lower group sort order numeric value or is the parent, like: SELECT ID, Name, CreatedDate FROM <Object_API_Name> WHERE ID IN {NestedGroupIds} |
Group Identifier | Enter a string or a merge field to uniquely identify each result returned by the query, like |
Content Value | Enter a string or a merge field to display some static or dynamic text for the item, like |
Start Date Field API Name | Enter a merge field that contains the start date of the record, like |
Link Id | Enter a merge field that contains the ID of the record for users to open the item's record page via a Gantt Chart Item popover, like |
4. Add the Timeline (kbvTimelineWrapper) component
After all of the Gantt Chart and Gantt Chart Item metadata records have been created, add the Timeline (kbvTimelineWrapper) Aura component to the record page of the parent object.
Open the record page in the Lightning App Builder.
Drag and drop the Timeline component to the desired location on the record page.
On the Configuration Name field, enter the Gantt Chart Name value of the Gantt Chart metadata record created in step 2.
Click Save.
5. (Optional) Configure the Gantt Chart Item popover
When users hover on an item in the enhanced timeline visualization, a popover with additional details on the item opens. The label of the popover is managed by the Popover Label (mvn__KHV_Popover_Label__c) field while the link on the label is managed by the Link Id (mvn__KHV_Link_Id__c) field on the Gantt Chart Item metadata record.
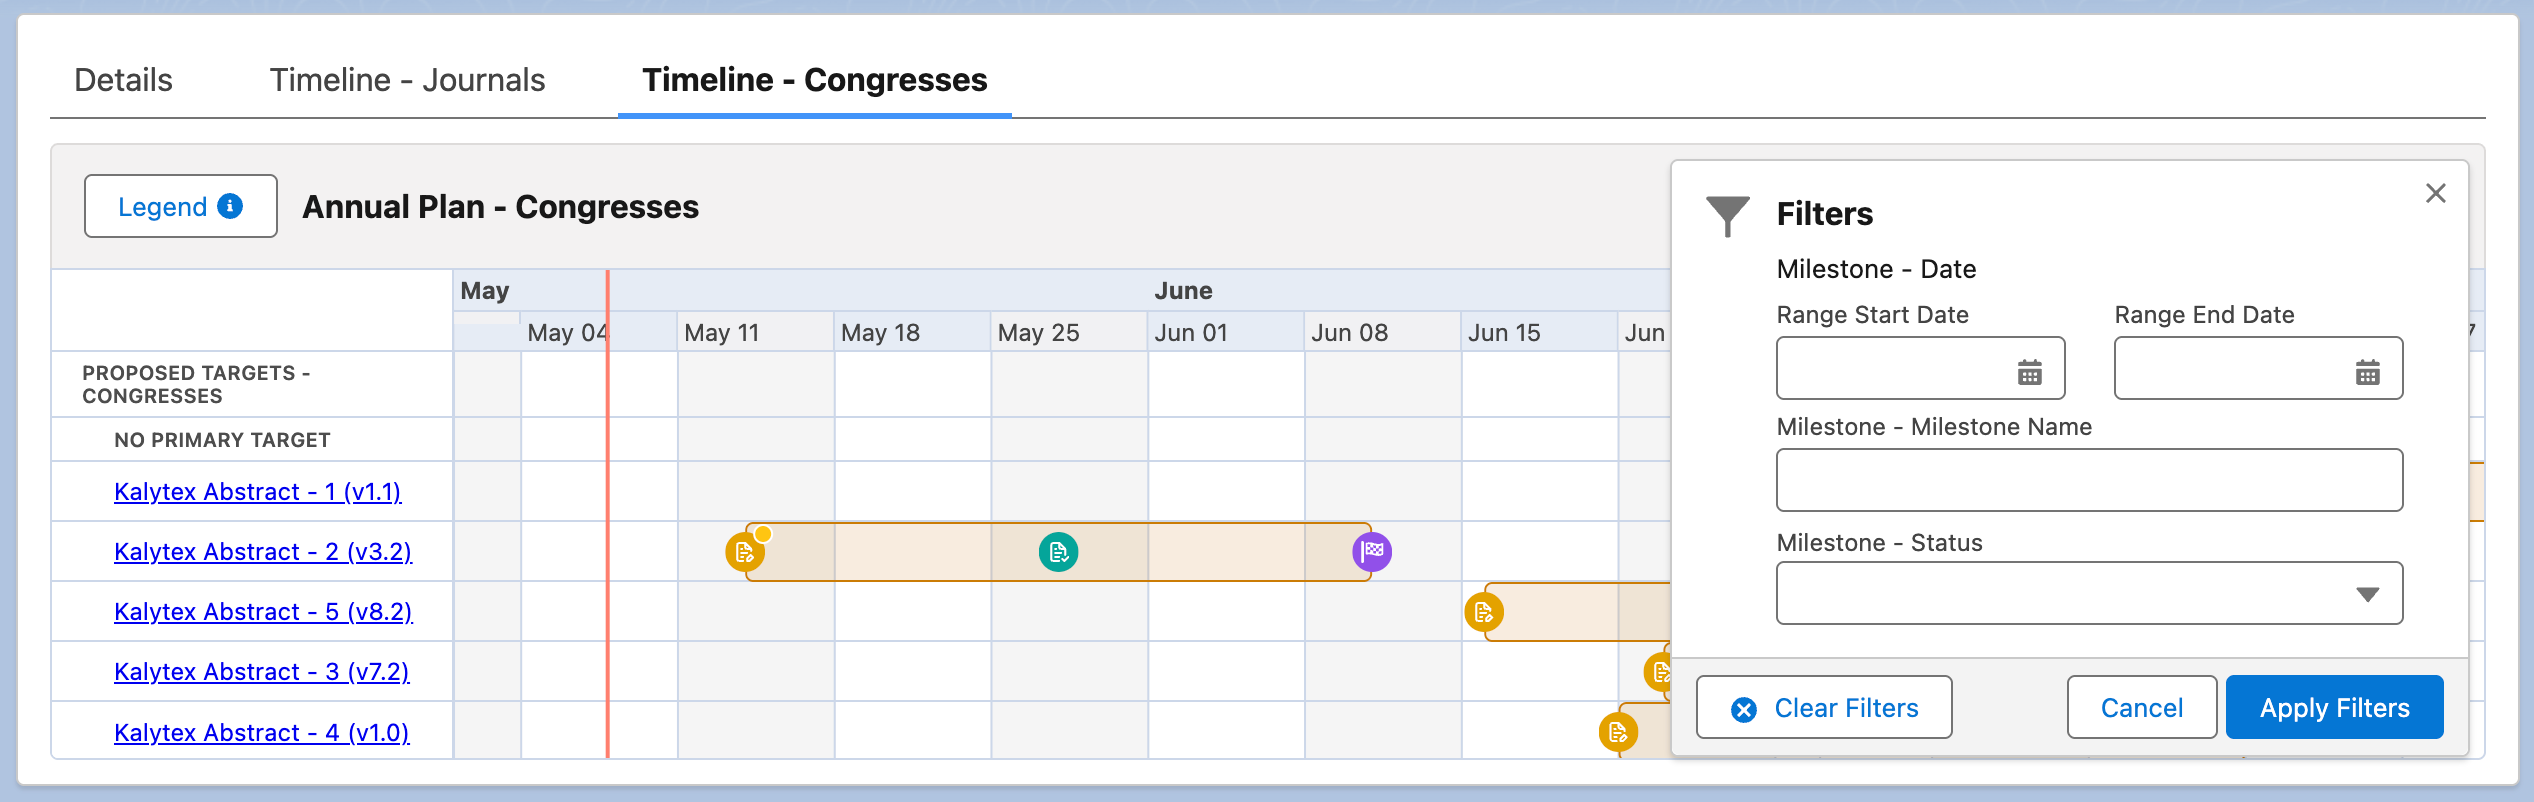
6. (Optional) Configure filter options
You can set certain object fields to be filter options so that users can filter the data that appears in the enhanced timeline visualization. To configure one or more fields as filter options, update the Filter Fields (mvn__KHV_Filter_Fields__c) field on the appropriate Gantt Chart metadata record. Each option will appear in the filter popover as "<Object name> - <Object field label>".
[
    {
        "sObjectLabel": "<Object name>",
        "sObjectType": "<Object API name>",
        "fieldApiName": "<Object field API name>"
    },
    {
        "sObjectLabel": "<Object name>",
        "sObjectType": "<Object API name>",
        "fieldApiName": "<Object field API name>"
    }
]
7. (Optional) Style the Timeline (kbvTimelineWrapper) component
You can use CSS to customize the appearance of the enhanced timeline visualization, such as configuring one or more icons, images, or colors to represent the items retrieved in a single Gantt Chart Item metadata record. To style the enhanced timeline visualization:
Create a new CSS file and gather any media files as needed.
Note
For each instance of the enhanced timeline visualization, you may only have one CSS file but can have multiple media files. Every CSS and media file will be uploaded as a static resource in step 4 below, and each of their paths should be prefixed with
/resource/.Warning
Every time you update an existing static resource, you may need to clear your browser's cache for the changes to appear immediately in the enhanced timeline visualization.
Identify the CSS class name you wish to modify and style. Each Type (
mvn__KHV_Type__c) picklist value on the Gantt Chart Item metadata record has a corresponding CSS class. For more information, reference the vis.js timeline examples.Table 123. Type value and CSS class nameType value
CSS class name
background
.vis-item.vis-background
box
.vis-item.vis-box
point
.vis-item.vis-dot
range
.vis-item.vis-range
Determine how you wish to style the items retrieved from a single Gantt Chart Item metadata record.
To configure one icon, image, or color to appear for all of the items, set the desired CSS properties for the class identified in step 2 above.
Table 124. Sample static styling for a point.vis-item.vis-dot { background-color: orange; background-image: url('/resource/<static_resource_zip_name>/images/<image_name>.png'); /*This assumes that the CSS and media files will be compiled into a zip file and uploaded as a single static resource in step 4.*/ background-size: cover; background-position: center; width: 20px !important; height: 20px; }To configure different icons, images, or colors to appear for different items based on a set criteria, input a merge field into the Class Name (
mvn__KHV_Class_Name__c) field on the Gantt Chart Item metadata record to use as a CSS class and then set the CSS properties for said class.Table 125. Sample dynamic styling for points.vis-item.vis-dot { /* This styles a merge field that has no value or evaluates to null. */ background-color: orange; } .vis-item.vis-dot.<value1> { /* This styles a merge field that evaluates to 'value1'. */ background-color: red; } .vis-item.vis-dot.<value2> { /* This styles a merge field that evaluates to 'value2'. */ background-color: green; }
Upload all of the files as static resources, including the CSS file and any media files as needed. You may upload each of the files either separately or together in a zip file.
Update the Gantt Chart metadata record created in step 2 and set the CSS Resource (
mvn__KHV_CSS_Resource__c) field to equal the static resource path containing the uploaded CSS file.Table 126. Sample styled mvn__KHV_Gantt_Chart__mdt metadata recordField label
Sample value
CSS Resource
/resource/<css_file_name>.css
8. (Optional) Add a custom legend
If you customize the appearance of the enhanced timeline visualization, you can also add a legend to explain the custom icons, images, or colors that are used. To create and add a legend:
Create a Lightning Web Component (LWC) for the legend. The isExposedFlag must be set to
true. For example:<?xml version="1.0" encoding="UTF-8"?> <LightningComponentBundle xmlns="http://soap.sforce.com/2006/04/metadata"> <apiVersion>62.0</apiVersion> <isExposed>True</isExposed> </LightningComponentBundle>Set the name of the LWC on the Legend Component (
mvn__KHV_Legend_Component__c) field of the Gantt Chart metadata record. The name of the custom LWC must be prefixed withc/. For example,c/AnnualPlanLegend.